Hindcast Lab
Hindcast Lab is a severe weather verification visualization. It reconstructs how tornado, severe wind, and severe hail days verified, turning the raw historical record into the probability fields and risk categories a perfect forecaster would have drawn, and grades SPC outlooks against them. Tornado data dates back to 1880, severe wind and hail data to 1955, SPC outlook data to 2002, and preliminary storm reports to 2003.
Alongside the verification tools, the Tropics tab is an ensemble viewer for Google DeepMind's experimental AI tropical cyclone forecasts (more below).
The three tools
- Hindcast Map: an adjusted "practically perfect hindcast" for any tornado day from 1880 to present or severe wind/hail day from 1955 to present: a probability field built from the day's actual tornado tracks (weighted by intensity and path length) or classified wind/hail reports, the verified SIG/CIG regions, the verified SPC risk category, and the day's all-time rank for that hazard. SPC outlooks and preliminary local storm reports can be overlaid for comparison.
- SPC Risk Diagram: each outbreak day plotted on the SPC probability × CIG conversion table for its hazard (tornado, wind, and hail tabs), using the exact same verification math as the map. Points plotted are the values from the location on the hindcast map verifying the furthest top-right on the SPC risk diagram.
- State Weights: how tornado, severe wind, or severe hail "weight" by intensity (and track length for tornadoes) distributes across the states for any set of years and months.
The three hazards
| Tornado | Wind | Hail | |
|---|---|---|---|
| What goes in | Tornado tracks (EF0-EF5) | Wind reports (W0-W5, from gusts and damage) | Hail reports (H1-H4, by hail size) |
| How far back | 1880 (rankings back to 1870) | 1955 | 1955 |
| What drives the PPH | Strength and track length | Report density, with big cities toned down | Report density, with piles of reports from one storm toned down |
| Probabilities | 2-60%+ | 5-90%+ | 5-60%+ |
| CIG | Up to CIG3, driven by intensity | Up to CIG3, needs counts and long swaths | Only up to CIG2, driven by counts |
| Highest possible risk | HIGH | HIGH | MDT |
Methodology
PPH: the adjusted practically perfect hindcast
A "practically perfect" forecast is the probability field a forecaster with perfect knowledge of the day's tornadoes would have drawn, used for verifying convective outlooks (Brooks, Doswell, and Kay 2003; Hitchens, Brooks, and Kay 2013). The classical construction smooths report points with a Gaussian kernel; the version here is adjusted so the field responds to how strong the tornadoes were, not just how many. For severe wind, each report is classified onto a W0-W5 scale and pushed through the same kernel density, calibration, and CIG code as tornadoes, with a few wind-specific caveats described in their own section below. Severe hail works the same way on an H1-H4 size-class scale, with its own caveats below.
- Intensity- and track-weighted kernel density: Each tornado contributes weight proportional to an EF-scale intensity factor times its path length raised to a sub-linear power, and that weight is deposited along the entire damage track (sampled every 0.5 km), not just the touchdown point. The field is smoothed with a Gaussian kernel at the selected bandwidth (default 25 miles) on a fixed CONUS grid, giving the familiar "probability of a tornado within 25 miles of a point."
- Calibrated probability cap: The day's total kernel weight maps to its peak probability through a fixed monotonic calibration curve, so a marginal one-tornado day can only reach a few percent while a generational outbreak can approach the top of the scale. Spatially detached secondary clusters are re-normalized toward their own weight, so a far-away set of tornadoes doesn't receive influence from the main outbreak's probability.
- Isolation damping: A single strong, long-tracked tornado with no surrounding activity is gently down-weighted, so one lone track doesn't paint an outbreak-sized probability blob.
- Era adjustment (1880–1949): The Grazulis record catalogues only significant (F2+) and killer tornadoes, so those days' fields are inflated by the modern record's typical ratio of total-to-significant kernel weight at that outbreak size, pushed through the same calibration curve. The adjustment ranges from 1.04× to 1.42× the original outbreak PPH and is multiplied on the PPH attached to all grid cells for recomputation.
CIG: conditional intensity group verification
In March 2026 the SPC replaced the binary "significant severe" hatching with nested Conditional Intensity Groups (CIG1–CIG3). For tornadoes this site verifies them from the observed tracks with an intensity-led score rather than a density one, so what a region could produce is set by its strongest tornado, with clustering only a secondary bonus. (Wind CIG inverts that philosophy; see the wind section below.)
- Each tornado deposits an EF-based intensity weight (EF2 = 1, EF3 = 3.8, EF4 = 11, EF5 = 14) along its whole track within a fixed 25-mile reference radius. This is deliberately independent of the map's bandwidth slider, so changing the PPH bandwidth never moves a CIG outline.
- The local score is the peak single-tornado weight plus a small fraction of the surrounding sum. Tier thresholds are set so a lone EF3 verifies CIG1, an EF3 with support verifies CIG2, and CIG3 requires an EF5, or an EF4 with strong neighboring support. Clusters of weak tornadoes cannot pile up into a higher tier. This attempts to emulate how when tornadoes are completely isolated but strong, some CIG threshold is introduced, but could not reach full CIG potential without nearby tornadoes demonstrating similar strength but also shows some support for situations where many tornadoes of a certain intensity could have "missed stronger structures" and thus could have verified a higher max intensity and thus a higher CIG level.
- Each higher tier must sit at least 25 miles inside the tier below. A tier carries along the full length of any track that verifies it, small isolated CIG1 fragments are dropped, and CIG1 is clipped to where the PPH is at least 1%. Selected days prior to March 3, 2026 can also be displayed with the legacy significant-severe (SIG) outline: any EF2+ tornado, clipped to the 10% PPH contour. It should be noted that the legacy SIG plays no role in calculations; it is purely for display.
- Verified risk category: Overlapping the PPH probability field (rows) with the drawn CIG tiers (columns) through the SPC's probability-by-CIG conversion table yields the day's verified outlook category (MRGL through HIGH), shown as the colored box on the map.
Severe wind PPH and CIG
Wind days run through the identical PPH and CIG code paths as tornado days. The differences are in what goes in (classified wind reports instead of damage tracks) and in the wind-specific calibrations below.
- Report classification (W0–W5): every convective wind report is placed on an EF-equivalent scale using the severer of its measured or estimated gust (50–55 kt = W0, 56–64 = W1, 65–73 = W2, 74–82 = W3, 83–91 = W4, above 91 kt = W5) and its damage wording, from generic trees and limbs down (W0) up through building-level destruction (W4); damage wording alone never reaches W5, which is reserved for measured extremes. Damage-only reports are nudged one class toward the nearest measured gust close by in space and time, since an anemometer next door is a better witness than a damage narrative.
- Sources and era handling: 2004 to present uses the IEM local storm report archive, matched against the SPC's filtered report files. 1955–2003 comes from the SPC severe weather database, where classification is by gust magnitude alone. Because reporting density grew roughly 29-fold across that era, historical days receive a density-compensation boost on the raw field (capped at 2.5×) and a gentler derived multiplier on CIG scores; the CIG count and swath gates are never relaxed.
- Density-led PPH: a wind report's deposit uses a strongly flattened intensity scaling, so the density of reports drives the probability field more than any single report's class; violent (W4/W5) reports still punch above the flattened scale, and further when they cluster together. Reports inside dense metros deposit less weight (population de-biasing), each detached cluster is re-normalized toward its own weight scaled by its footprint, and isolated reports are damped. The day's total KDE weight maps to peak probability through a wind-specific calibration curve anchored to benchmark derechos, with the highest 90s reserved for days of that class.
- Count- and swath-led wind CIG: one report can never carry a
tier the way one violent tornado can; tiers are earned by report
counts and by connected swath length, mirroring how the SPC frames
wind CIG2/CIG3 as long-lived MCS and derecho categories. Damage-worded
reports carry less CIG weight than measured gusts of the same class.
CIG1 needs roughly a measured 74+ kt gust with nearby support or four
to five W2-class reports in a local corridor. CIG2 needs multiple
significant (W3+) reports plus a connected W3+ swath spanning about
290 km, or a 400 km W2+ swath carrying at least two violent reports.
CIG3 is reserved for high-end derechos:
- A W3+ swath spanning about 650 km
- A W5 near another violent report, or three or more W4s with W3 support
- A minimum total area.
- Verified wind risk category: the same probability × CIG overlap as tornadoes, but through the SPC's wind conversion table, including the 75% and 90% probability bands the SPC introduced in March 2026.
Severe hail PPH and CIG
Hail days run through the identical PPH and CIG code paths, with hail's own calibrations. Unlike wind, hail classifies by size alone, and its SPC outlook framework only reaches CIG2 with a verified category that caps at MODERATE.
- Report classification (H1–H4): every severe hail report is classed by its reported size: H1 = 1.00–1.49" (small hail), H2 = 1.50–1.99" (moderate), H3 = 2.00–3.49" (large), and H4 = 3.50"+ (giant). Sub-severe hail under 1.00" is dropped.
- Sources and era handling: 2004 to present uses the IEM local storm report archive, matched against the SPC's filtered report files (2"+ reports always survive the match). 1955–2003 comes from the SPC severe weather database. Severe-hail reporting grew roughly 30-fold across that era, so historical days receive a density-compensation boost (capped at 2.5×) with a gentler multiplier on CIG scores; CIG count gates are never relaxed.
- Density-damped PPH: hail deposits use the same flattened intensity scaling as wind, plus a hail-specific report-density damping: a stack of reports crowded under one long-lived supercell gives back much of its weight, so a single storm's report pile can never outrank a widespread multi-supercell outbreak. Metro reports are population de-biased, detached clusters re-normalize toward their own footprint, and the calibration curve turns exponential past a 60% knee with a hard 80% asymptote: the biggest hail days on record verify in the mid 60s, and pushing beyond that is meant to be very hard. Display thresholds follow the SPC hail convention (5–60%).
- Count-led hail CIG (CIG1 and CIG2 only): a single giant (H4) report verifies CIG1 by itself; otherwise CIG1 needs roughly two large (H3) reports nearby, one H3 with a couple of H2s, or a broad corridor of H2s. CIG2 requires more than one H4 somewhat nearby, an H4 with a couple of nearby H3s, or a high count of H3s in one corridor; no amount of H1/H2 hail can ever reach CIG2. CIG1 is clipped to the 5% probability contour.
- Verified hail risk category: the same probability × CIG overlap through the hail conversion table, which caps at MODERATE: MDT requires 45%+ over CIG2 or 60%+ over CIG1.
How PPH and CIG drive everything on the site
- Hindcast map: draws the selected hazard's PPH field, the CIG (or legacy SIG) outlines, and the verified risk box directly from the computations above; the probability cursor and Max Prob box read the same grid.
- Risk diagram: plots each day at its most top-right verifying cell of its hazard's conversion table: y = the PPH probability there, x = the CIG tier plus continuous progress toward the next tier. Because it shares the map's exact code, a day's point always agrees with the map's risk box.
- All-time rank (map badge and the diagram's top-days): a composite score per 7am-CST convective day, each term normalized to its all-time maximum, ranked separately per hazard. Tornado days: 28% peak PPH probability, 2% PPH areal integral, 32.5% a violent-tornado term (EF3+ count weighted by intensity and √track length), and 37.5% CIG tier areas weighted 1 : 3 : 8. Wind days: 22% peak probability, 8% areal integral, 10% a violent term (W3+ report counts weighted by class), and 60% CIG tier areas weighted 0.75 : 3.5 : 18, the heavy CIG3 multiplier reflecting how much rarer wind CIG3 is. Hail days: 28% peak probability, 5% areal integral, 29.5% a giant-hail term (H3+ report counts weighted by class), and 37.5% CIG tier areas weighted 1 : 4. In every case, most of the score comes straight from the PPH and CIG fields.
- Day statistics: the map's Detailed Statistics panel scores each day with the outbreak intensity score of Grazulis (2023): significant tornadoes only, with EF2 = 2, EF3 = 5, EF4 = 10, and EF5 = 15 points. Its regional rarity comparison sums the day's tornado weight within 300 km of the day's weight-centroid and ranks it against every tornado day in that region across the 1950–present US record, both overall and against the same time of year (±15 days), bucketed by 7am-CST convective day. Wind days score as such: W0 = 0.1, W1 = 0.18, W2 = 1, W3 = 3.8, W4 = 11, W5 = 14, and center the 300 km comparison on the dominant probability blob. The dominant probability blob is the connected region around the day's peak, so the rarity question is asked where the day verified highest. Wind ranks run against the 1955–present record. Hail days work the same way with H1 = 0.18, H2 = 1, H3 = 3.8, H4 = 11, centered on the dominant hail probability blob and ranked against a 2004–2025 Storm Data reference (days outside that span rank live against it).
- State weights: each tornado's weight is the CIG intensity table times a PPH-style footprint term, (1 + track in km / 40), 40 km being the fixed CIG reference bandwidth; the choropleth sums those weights by tornado touchdown state. The full intensity table spans EF0 = 0.10, EF1 = 0.18, EF2 = 1, EF3 = 3.8, EF4 = 11, EF5 = 14 (unknown ratings count as EF0), so a lone EF5 outweighs dozens of weak tornadoes while long tracks add proportional footprint on top. Wind and hail reports use the same intensity table on their W0–W5 and H1–H4 classes with no track term, summed by report state. For the selected years and months, the default metric is each state's share of the summed weight, 100 × state weight / total weight; the land-area mode instead divides each state's weight by its land area in units of 10,000 km², turning share into climatological density. Map shading applies a square-root normalization to the maximum value, which keeps mid-range states distinguishable when one state dominates.
Tropics & Google DeepMind
The Tropics tab is an ensemble viewer for Google DeepMind Weather Lab's experimental AI tropical cyclone forecasts (the WeatherNext family of models). Every member track, ensemble mean, density map, probability and statistic on that page is built from Weather Lab's published cyclone track files. This site is an independent viewer: it is not affiliated with, sponsored by, or endorsed by Google, and nothing on it is an official forecast.
Credit & terms of use
© 2024-6 Google LLC, whose machine learning models were used to create the experimental data made available under the following licence terms: https://storage.googleapis.com/weathernext-public/terms-of-use.pdf. This data is intended for experimental modelling only and is not intended, validated, or approved for real world use.
Legally Binding Terms of Use: By using this information, you agree to the Terms of Use found at https://storage.googleapis.com/weathernext-public/terms-of-use.pdf. Forecast data that relates to a time less than one hour ago or to the future falls under those real-time terms; once it relates to a time an hour or more in the past it is licensed under CC BY 4.0. For official forecasts, watches and warnings, always use your national meteorological service (in the U.S., the National Hurricane Center).
The three ensembles
| Viewer name | Weather Lab model | Members | Notes |
|---|---|---|---|
| FNV3 50 | FNV3 operational ensemble (FNV3P2, older cycles FNV3) | 50 | The WeatherNext 2-generation cyclone model's operational ensemble; usually the first to publish (~6.3 h after cycle time). |
| FNV3 1000 | FNV3_LARGE_ENSEMBLE | 1,000 | The same model run as a 1,000-member ensemble, with Weather Lab's official ensemble mean. Best for tail risks (~7.5 h). |
| WNV3 | WNV3 (WeatherNext 3) | 64 | WeatherNext 3's operational ensemble, launched September 2026 (~7 h). |
The three are separate models and are never blended: switching models (keys 1 / 2 / 3) swaps the whole ensemble, and every number on the page describes only the model on screen. Each runs four cycles a day (00, 06, 12, 18 UTC).
How the data gets here
The site checks Weather Lab every two minutes for a newly published cycle. When one appears, a cloud job downloads Weather Lab's cyclone CSV files (per-storm ensembles and the worldwide cyclogenesis file), converts them, and uploads them to the site, usually within minutes of publication. The newest few cycles are kept live (about a day and a half); selected past storms are kept in an archive for replay. Storm positions, names and categories come from the National Hurricane Center and the Joint Typhoon Warning Center (see the sources below), not from Weather Lab.
What this viewer changes (modification notice)
- Format & precision: Weather Lab's CSV rows are converted to per-member tracks; positions are rounded to 0.01°, winds to 0.1 kt and pressures to 0.1 hPa.
- Wind radii: the four quadrant radii of 34, 50 and 64 kt winds are averaged into one mean radius per threshold.
- Repaired tracks: Weather Lab's tracker sometimes loses a weak system and re-finds it later as a new low in the cyclogenesis file. A same-member genesis track that starts within 30 h and 600 km of where a storm track ends is joined to it.
- Worldwide genesis view: tracks belonging to already-named storms are removed (by Weather Lab's track label, plus any track that starts within 450 km of a named storm in the first 24 h), so that view shows new development only.
- Invests: for an invest, the viewer may use the members of the matching cluster in the worldwide run when that cluster is larger than the invest's own run; the page says so when it does.
- Derived products: densities, probabilities, statistics and trends (below) are computed by this site, not by Google.
What the products mean
- Member tracks are colored by each member's own sustained wind at that point. Click one to isolate it; double-click the map to go back to all members.
- Ensemble mean is Weather Lab's official mean track when one is published, with 24 h (or 6 h) labels.
- Track density is the percentage of members whose track passes within 150 km of a point. Formation and dissipation density do the same for where members form and where they end.
- Wind probability is the percentage of members whose wind field reaches the chosen speed (34 kt and up) at a point. Each member's wind field is built from its own radius of maximum wind and 34/50/64 kt radii, interpolated for other speeds.
- Member-total adjustment: Weather Lab's storm files include only the members that actually have the system (for example 60 of 1,000 for an early disturbance). With the adjustment on, percentages are out of the whole ensemble, so 60 members means 6 % formation, not 100 %.
- Track statistics (key S): peak-intensity percentiles, the chance of reaching each Saffir–Simpson category, and rapid intensification odds using the SHIPS-RII thresholds (+25 to +65 kt over 24–48 h; +30 kt in 24 h is NHC's definition of RI). RI counts from the map's time slider onward unless Lifetime is ticked.
- Run trends (key T) compare those numbers run to run, so you can see whether the guidance is trending stronger, weaker or shifting.
- Landfall (key L) estimates where and how strong members come ashore.
Quick tutorial
- Pick a system from the storm menu, the slider, or by clicking its marker. While one is selected, other systems are hidden (key W to re-show other systems).
- Pick a model: FNV3 50, FNV3 1000 or WNV3 (keys 1–3), and how many members to draw.
- Scrub time with the bottom slider or the ← / → keys; ↑ / ↓ step to newer or older runs.
- Filter on the left: peak intensity, a member number, the top X % strongest members, a single forecast hour, landfalling or non-landfalling members, or members passing through an area you draw. That area selection can also be compared against the rest of the ensemble.
- Switch the map to track density (D) or wind probability (P), and add context layers: NHC outlook areas (N), the NHC cone (C), operational model guidance (O), sea-surface temperature and ocean heat content.
- Read the numbers in the statistics card (S) and run trends (T). The filter pill under the title lists any active filters.
- Share a PNG (E) or a GIF / MP4 of the runs (A); exports carry the Google DeepMind credit. Press ? for every shortcut.
Caveats
- These are experimental AI research forecasts. They have not been validated for real-world decisions and can be confidently wrong, especially for weak systems, rapid intensification and landfall timing.
- An ensemble's spread is not a full measure of uncertainty: all members share one model's biases.
- Percentages describe the ensemble on screen and depend on the filters and the member-total adjustment.
- Weather Lab can change, delay or withdraw its data at any time.
Data sources & references
- U.S. tornadoes, 1950–2024, severe wind reports, 1955–2003, and severe hail reports, 1955–2025: NOAA/NWS Storm Prediction Center, Severe Weather Database (SVRGIS). Whole-track tornado records; multi-state segment rows are deduplicated so each tornado counts once. Historical wind rows carry gust magnitude only, so they classify by kt bin.
- U.S. tornadoes, 2025–present: NOAA/NWS Damage Assessment Toolkit (DAT), queried live for dates newer than the local archive. Recent events are preliminary until surveys are finalized.
- U.S. tornadoes, 1880–1949: Grazulis, T. P. (1993): Significant Tornadoes, 1680–1991, Environmental Films, and the historical tornado research of Blue Ayanami, as digitized and compiled by the Tornado Archive. Grazulis chronicled significant (F2+) and killer tornadoes; Blue Ayanami's independent research complements that record by documenting, rating, and re-surveying historical tornadoes beyond that scope, adding weaker tornadoes to thousands of pre-1950 days and updated tornado counts for major outbreaks.
- Canadian tornadoes, 1950–2020: Northern Tornadoes Project, Western University (CC BY-NC 4.0), via the ECCC/NTP hosted feature layer. No Canadian data after 2020.
- SPC convective outlooks & local storm reports: Iowa Environmental Mesonet archives, Iowa State University (outlook GIS archive and LSR service). Tornado LSR coverage begins ~2003; wind and hail LSRs (2004–present) are matched against the SPC's daily filtered storm report files to remove duplicate reports of the same gust or stone.
- State geometry & land areas: U.S. Census Bureau cartographic boundary files (2023, 1:20,000,000).
- Place names: GeoNames gazetteer (CC BY 4.0), used to name the largest town near each tornado track.
- Tropical cyclone ensembles: Google DeepMind Weather Lab cyclone track files (FNV3, FNV3 large ensemble, WeatherNext 3), © 2024-6 Google LLC, experimental data under the GDM Real-Time Weather Forecasting Experimental Data Terms of Use (CC BY 4.0 once an hour old); modified as described above.
- Active storms, cones & outlooks: NOAA National Hurricane Center (current storms, forecast cone GIS, Tropical Weather Outlook areas); Naval Research Laboratory and JTWC storm/invest lists; best-track b-decks and operational model a-decks (ATCF) from NHC and the UCAR/NCAR RAL tropical cyclone guidance project.
- Ocean: NOAA OISST v2.1 sea-surface temperature (via NOAA CoastWatch ERDDAP) and NOAA/AOML ocean heat content.
- Basemaps: © Mapbox and © OpenStreetMap contributors.
Methodological references
- Brooks, H. E., C. A. Doswell III, and M. P. Kay, 2003: Climatological estimates of local daily tornado probability for the United States. Wea. Forecasting, 18, 626–640.
- Hitchens, N. M., H. E. Brooks, and M. P. Kay, 2013: Objective limits on forecasting skill of rare events. Wea. Forecasting, 28, 525–534. (The "practically perfect" forecast framework.)
- NOAA/NWS Storm Prediction Center: convective outlook product definitions and the outlook probability and category reference, including the 2026 conditional intensity group (CIG) framework that replaced significant-severe hatching.
All probability colors, thresholds, and risk-category colors follow SPC conventions. The verification math on this site is an independent reconstruction, not an official SPC product.
About the Creator
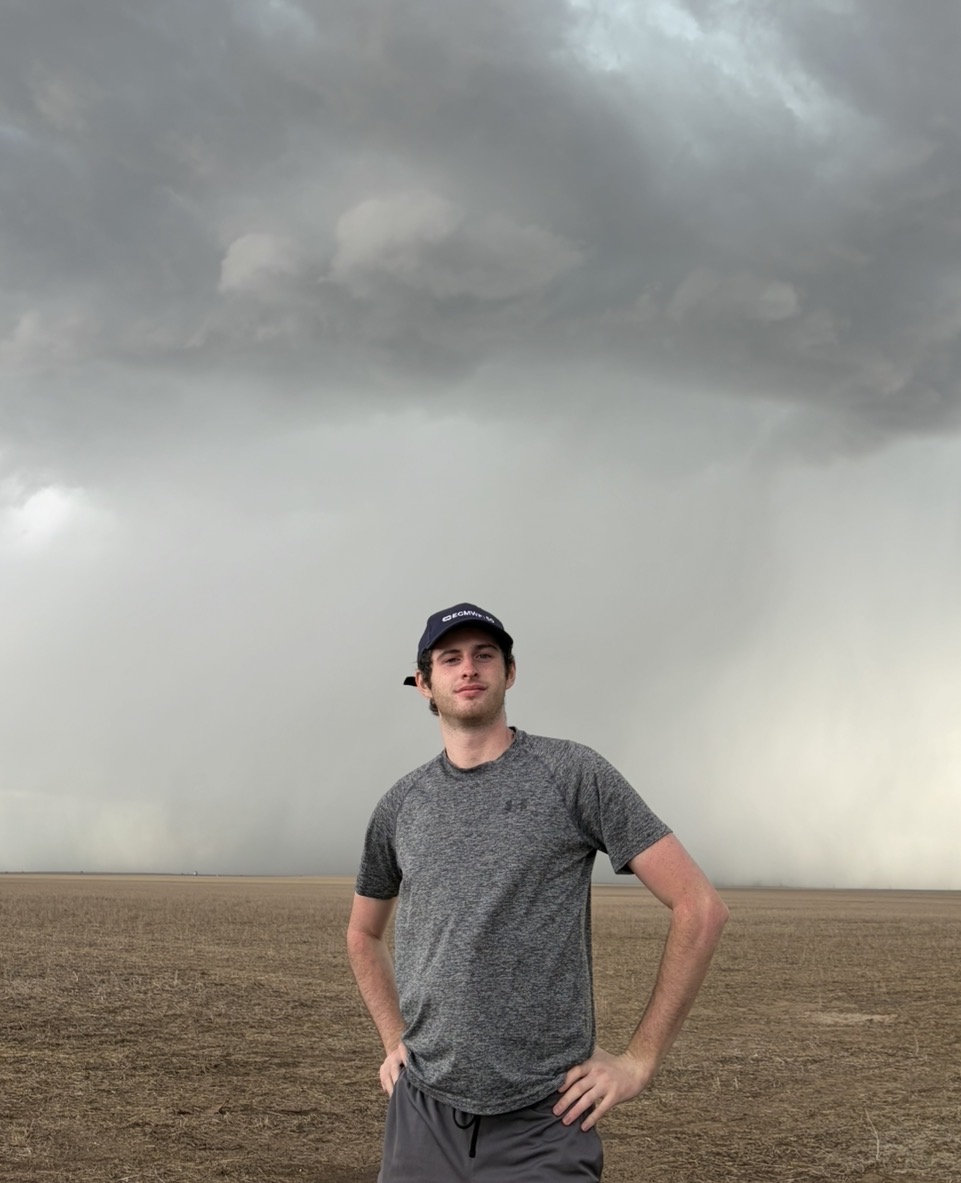
Hey, thank you for visiting this site! I'm Packie Young, a meteorologist and data scientist recently graduated from Cornell who loves to script plots to visualize weather data. This was a project I began in 2025 to teach myself about historical tornadoes and the inner workings of a Storm Prediction Center (SPC) forecast. I started off by coding in simple SPC verification definitions and Northern Illinois University's practically perfect hindcast techniques as a more custom viewer than what is available elsewhere and then new ideas flowed about how to optimize and expand, especially as the SPC shifted to a new Conditional Intensity Group system. I worked on all of these methodologies with generous help from several peers, both with and without meteorology degrees, to anecdotally confirm validity. I hope that someday with enough positive reputation, the products will achieve some level of statistical validity, given the unorthodox mathematical route I took to produce the hindcast algorithm. On a different note, I like to explore the world and, of course, chase tornadoes. My most successful storm chase to date is my intercept of the Greenfield, IA EF4 back on May 21, 2024. Take a look at it on the hindcast map!